Flight-Dynamics Data Logger
|
|
|
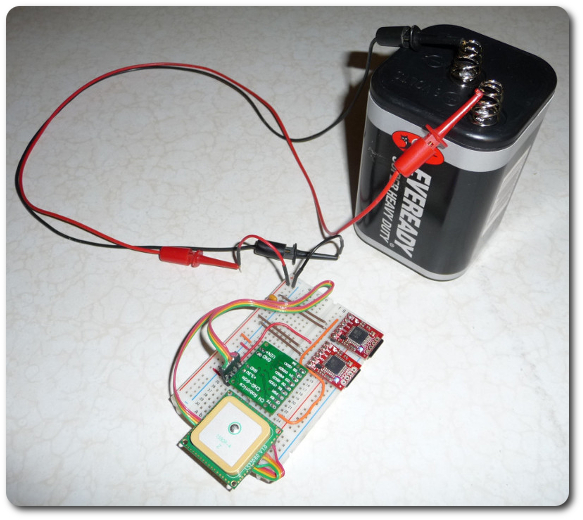
I have no intention of fabricating a printed circuit board for this system at this point, so it needs to operate directly from the breadboard. This makes the startup and shutdown procedures a ltitle unfriendly. I need to plug in the power in stages to allow the GPS and AHRS to come online before the loggers. Then to be sure the loggers write their last data to Flash memory, I need to unplug the GPS and AHRS first.
|
|
|
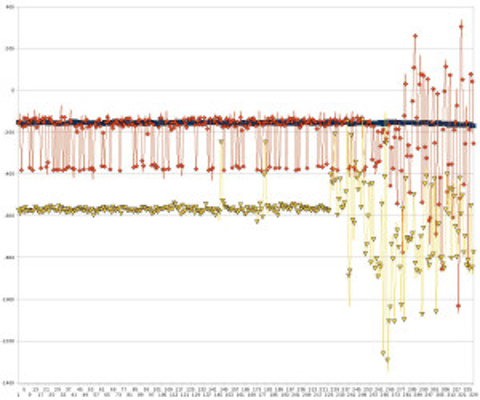
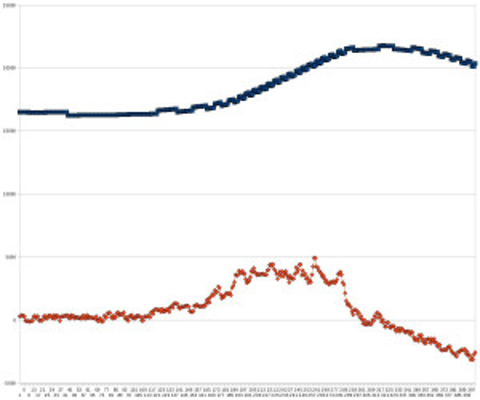
At this point, I'm still trying to interpret the data. This is magnetic x, y, and z, gyroscopic x, y, and z, and accelerometer x, y, and z.
|

|
|
|
|
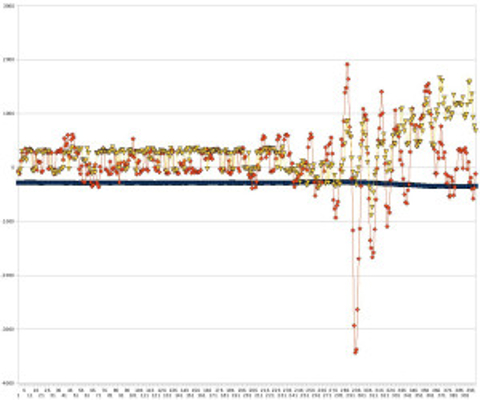
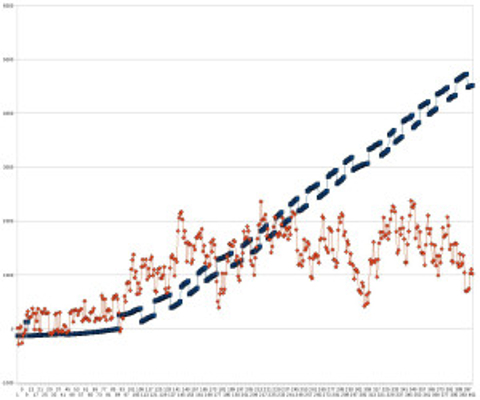
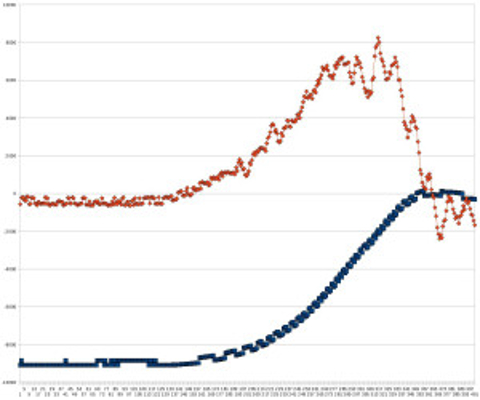
And this is yaw, pitch, and roll, and yaw, pitch, and roll rate.
|
|
|
|
|
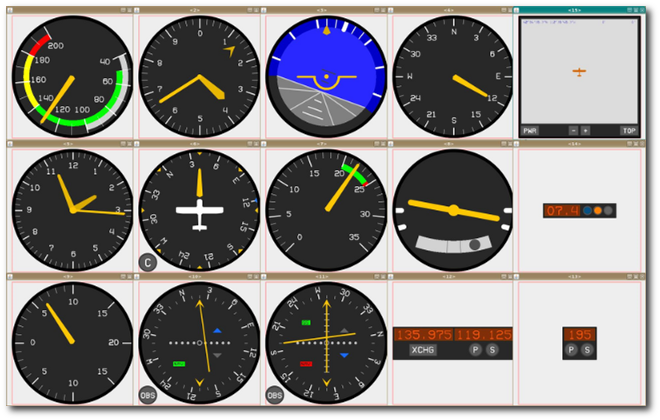
All of which was supposed to feed into the flight-dynamics model that the students were going to use to build the instrumentation for a simulated unmanned aerial vehicle. This is a piece of my own solution, which I provided in parts. The students got the application programming interface (API) I developed for it so they didn't have to implement the low-level graphics and other aspects outside the scope of the project. Being new to EWU, I overestimated the abilities of the students at that level, so we didn't get quite as far as planned, but it was still successful.
|
|
|
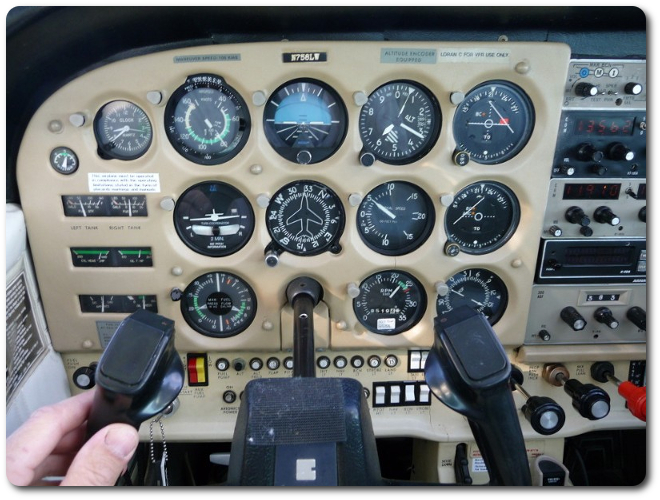
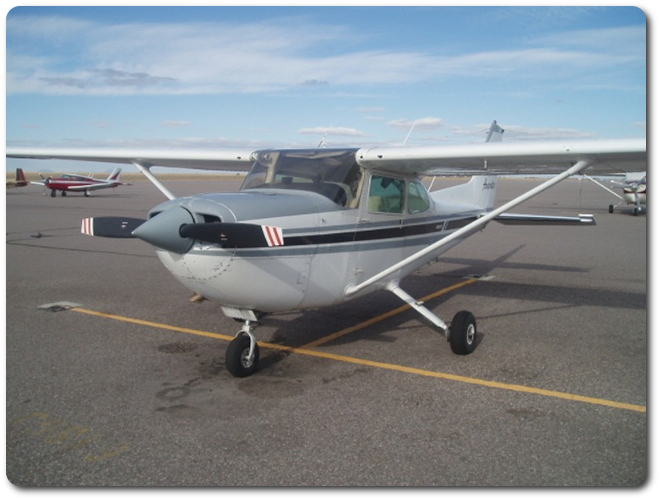
The instrumentation was meant to correspond to the real thing, at least in part — I simplified or eliminated some of the elements and took some liberty with the colors. One reason is simply for contrast so we can see everything clearly on the projector screen in the classroom. I couldn't have faked pictures with better flight parameters.
|
|

|
|
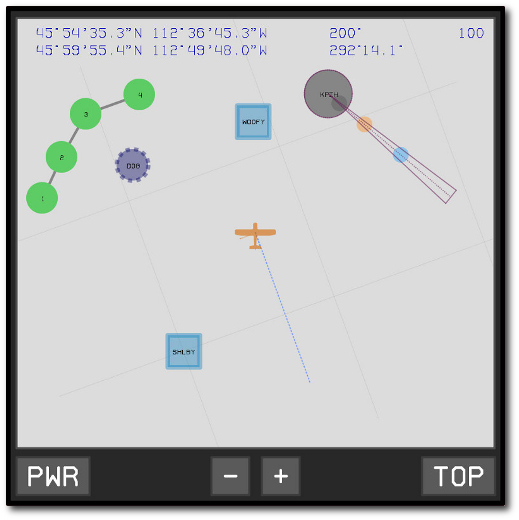
One of the elements I simplified was the GPS display (which is still actually better than my real one duct-taped to the panel above). I'd like to use actual FAA charts, like the one on my lap, but I didn't have time to implement this. I was toying with the idea of having the students design a map builder, but I suspected it would be too difficult for them.
|
|
Here the green dots are waypoints, the cogged wheel is an NDB (non-directional beacon), the blue boxes are VOR/DME (very-high-frequency omnidirectional range/distance measuring equipment) stations (no surprise that we always use the acronym only), the gray circle is an airport (Pocatello), with its ILS (instrument landing system) localizer and glideslope, as well as marker beacons, and the dotted barb from the plane is true north. This doesn't look anything like a normal VFR or IFR chart, but the essential information is still here for instrument flying, which is what our UAV simulator is based on. Note that even though the graphics here are cheesy, the coordinate system is true longitude and latitude (although I use a flat-Earth model), and the localizer/glideslope rendering is to scale.
|
|
|
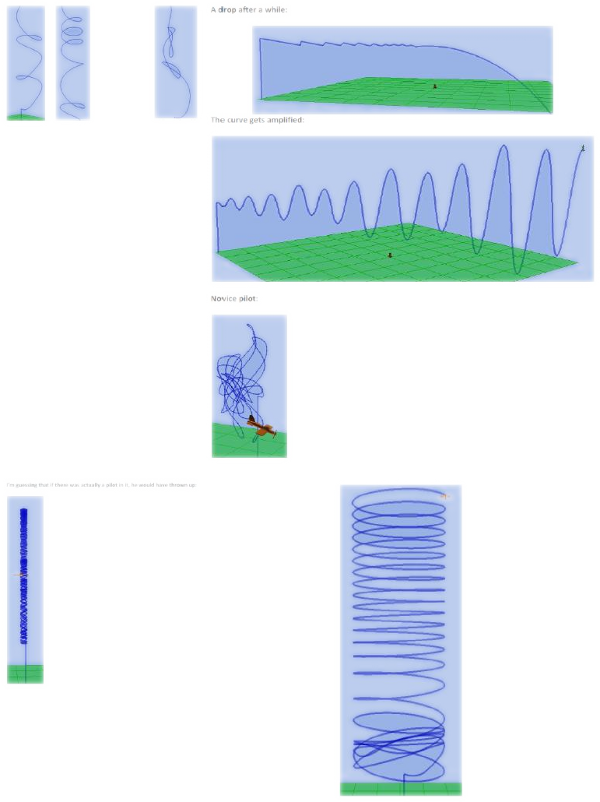
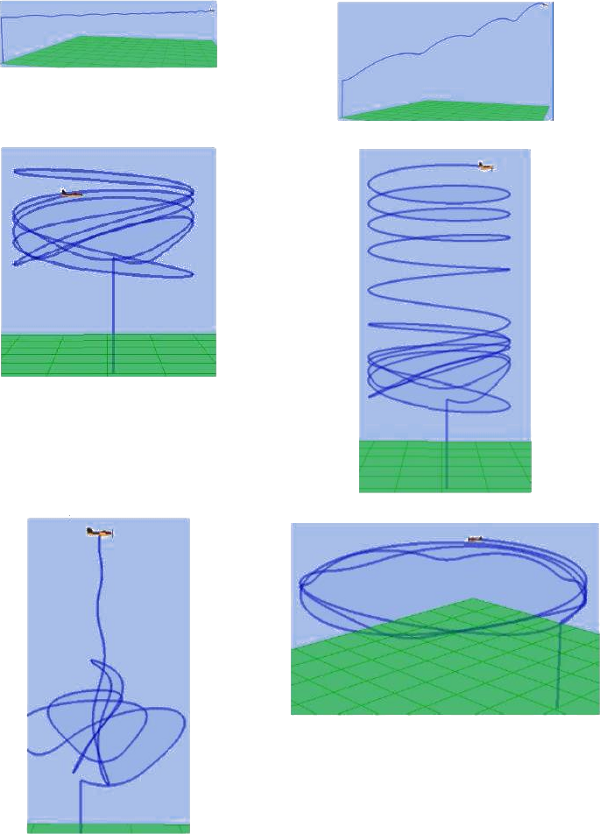
At this point in the narrative, the Flight-Dynamics Model describes some of the data collection.
|
|
|
The entire system is an integration of existing components that I provide and those that the students develop themselves (plus those they specify that I develop for them). The idea is to show the many and varied facets of a full-fledged software system while still making the overall project reasonable for a one-semester undergraduate course. The three-dimensional interactive viewer I'm providing derives from my dissertation and a major modeling-and-simulation system I developed for the Department of Defense and several papers I've published on artificial intelligence, plus various flavors used in previous classes.
|
|
|
|
|
© 2026 Dan Tappan and Eastern Washington University
— last updated 27 May 2026 11:43